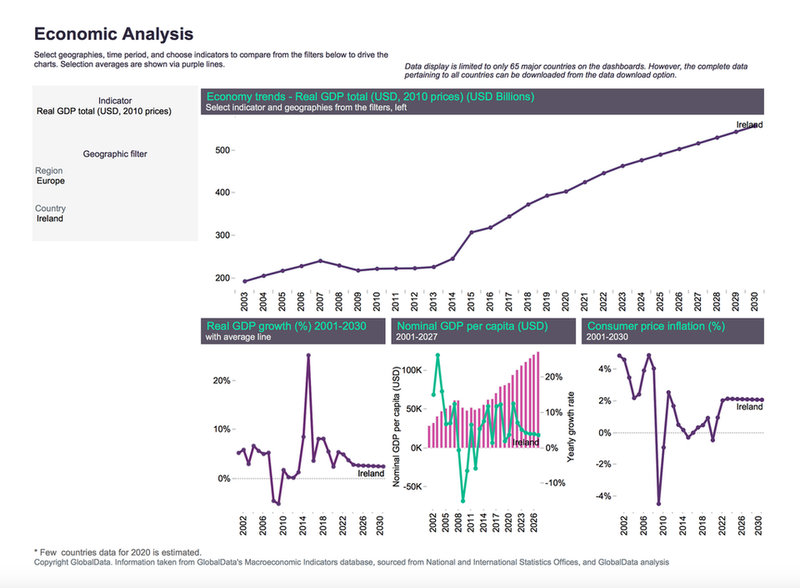
ECONOMIC INDICATORS
Macro-Economic Indicators: Ireland
Powered by
Real GDP total (USD, 2010 prices), US billions
Real GDP growth (%) 2001-2030, with average line
| Value | Year |
192.7670495 | 2003 |
205.7236044 | 2004 |
217.4500342 | 2005 |
228.4767092 | 2006 |
240.6414205 | 2007 |
229.8597621 | 2008 |
218.1846964 | 2009 |
222.1337942 | 2010 |
222.896693 | 2011 |
223.3998038 | 2012 |
226.4193512 | 2013 |
245.793349 | 2014 |
307.6411818 | 2015 |
318.9556578 | 2016 |
344.9355411 | 2017 |
373.1163288 | 2018 |
393.8234164 | 2019 |
403.5607988 | 2020 |
425.5053803 | 2021 |
446.665001 | 2022 |
463.6497242 | 2023 |
476.9738871 | 2024 |
490.0438718 | 2025 |
503.2504624 | 2026 |
516.5986852 | 2027 |
530.0697148 | 2028 |
543.6547489 | 2029 |
557.3445983 | 2030 |
Real GDP growth (%) 2001-2030, with average line
| Value | Year |
5.278431047 | 2001 |
5.919816382 | 2002 |
3.019968413 | 2003 |
6.721353523 | 2004 |
5.700089642 | 2005 |
5.070900539 | 2006 |
5.324267559 | 2007 |
-4.480383476 | 2008 |
-5.079212472 | 2009 |
1.809979312 | 2010 |
0.343441112 | 2011 |
0.22571479 | 2012 |
1.351633847 | 2013 |
8.556688153 | 2014 |
25.1625331 | 2015 |
3.67781581 | 2016 |
8.145296263 | 2017 |
8.169870718 | 2018 |
5.549767182 | 2019 |
2.472525 | 2020 |
5.43773863 | 2021 |
4.972820967 | 2022 |
3.802564132 | 2023 |
2.873756249 | 2024 |
2.740188744 | 2025 |
2.69498128 | 2026 |
2.652401479 | 2027 |
2.607639172 | 2028 |
2.562876865 | 2029 |
2.518114558 | 2030 |
Nominal GDP per capita (USD) 2001-2027
Consumer price inflation (%) 2002-2030
| Year | % Difference in Value | Value |
2001 | 28367.53235 | |
2002 | 15.14% | 32663.47633 |
2003 | 26.38% | 41278.53071 |
2004 | 16.11% | 47928.35796 |
2005 | 6.82% | 51198.36095 |
2006 | 7.08% | 54825.73811 |
2007 | 12.5% | 61680.71411 |
2008 | -0.58% | 61325.35582 |
2009 | -15% | 52124.85065 |
2010 | -6.44% | 48769.16533 |
2011 | 6.63% | 52002.77298 |
2012 | -5.76% | 49008.13099 |
2013 | 5.48% | 51692.03974 |
2014 | 7.64% | 55640.31594 |
2015 | 11.88% | 62250.27643 |
2016 | 1.5% | 63181.92407 |
2017 | 11.85% | 70670.80861 |
2018 | 12.39% | 79429.04769 |
2019 | 1.96% | 80989.57818 |
2020 | 3.8% | 84065.2905 |
2021 | 12.62% | 94676.21433 |
2022 | 7.21% | 101502.7858 |
2023 | 5.23% | 106812.2707 |
2024 | 4.32% | 111431.3333 |
2025 | 4.06% | 115954.67 |
2026 | 3.99% | 120578.8697 |
2027 | 3.7% | 125045.8693 |
2027 | 3.7% | 125045.8693 |
2026 | 3.99% | 120578.8697 |
2025 | 4.06% | 115954.67 |
2024 | 4.32% | 111431.3333 |
2023 | 5.23% | 106812.2707 |
2022 | 7.21% | 101502.7858 |
2021 | 12.62% | 94676.21433 |
2020 | 3.8% | 84065.2905 |
2019 | 1.96% | 80989.57818 |
2018 | 12.39% | 79429.04769 |
2017 | 11.85% | 70670.80861 |
2016 | 1.5% | 63181.92407 |
2015 | 11.88% | 62250.27643 |
2014 | 7.64% | 55640.31594 |
2013 | 5.48% | 51692.03974 |
2012 | -5.76% | 49008.13099 |
2011 | 6.63% | 52002.77298 |
2010 | -6.44% | 48769.16533 |
2009 | -15% | 52124.85065 |
2008 | -0.58% | 61325.35582 |
2007 | 12.5% | 61680.71411 |
2006 | 7.08% | 54825.73811 |
2005 | 6.82% | 51198.36095 |
2004 | 16.11% | 47928.35796 |
2003 | 26.38% | 41278.53071 |
2002 | 15.14% | 32663.47633 |
2001 | 28367.53235 |
Consumer price inflation (%) 2002-2030
| Value | Year |
4.872904873 | 2001 |
4.614733277 | 2002 |
3.49048968 | 2003 |
2.199628507 | 2004 |
2.429691984 | 2005 |
3.931639895 | 2006 |
4.897115644 | 2007 |
4.060304951 | 2008 |
-4.478103392 | 2009 |
-0.922095829 | 2010 |
2.557188832 | 2011 |
1.696208973 | 2012 |
0.508714869 | 2013 |
0.182542317 | 2014 |
-0.289879079 | 2015 |
0.008306338 | 2016 |
0.340531561 | 2017 |
0.488370168 | 2018 |
0.939044481 | 2019 |
-0.458541 | 2020 |
0.96755016 | 2021 |
2.045159151 | 2022 |
2.152799107 | 2023 |
2.143199287 | 2024 |
2.133599468 | 2025 |
2.123999649 | 2026 |
2.11439983 | 2027 |
2.104800011 | 2028 |
2.095200193 | 2029 |
2.085600374 | 2030 |
Source: GlobalData analysis based on information from Organisation for Economic Co-operation and Development (OECD), The World Bank and International Monetary Fund